A Critical History of Acquisition through Social Media
In the popular press book, The Culture of Connectivity: A Critical History of Social Media[1], author José Van Dijck makes a compelling argument about the dialectical nature of social media. That is, social media capitalizes on the inter-connectedness between humans and machines. She contends that connectedness is human driven as human users share information on social media with other users. However, connectivity refers to the interplay between the platforms and 3rd party companies that purchase society’s behavioral data from these social media companies. The selling of this data is the “Golden Egg” for social media companies like Facebook, Twitter, Instagram, etc.
Today, consumers are well aware that social media companies are selling their website and social media data to 3rd parties. It is inevitable that as you search for products on Google or Amazon, or according to many skeptics like Digital Trends[2], even say those searchable words out loud, you will soon be presented with digital advertisements for those products. There is little doubt in our society today that these practices are governed by society’s acceptance of each company’s Terms of Service Agreement. Most often, these terms are not read but methodically authorized by a single click of the mouse or trackpad to allow social media companies full access and rights to distribute the behavioral data as they desire. Whether you agree or disagree with this practice is of little consequence. If you are using the platform, then you have provided the social media company the authority to distribute and use your behavioral data.
Many individuals are not discouraged by this practical use of social media data. In fact, many see it as a convenience. In this current digital age, where convenience is the mantra, consumers question why would someone not want companies providing information that an individual wants or needs in the fastest amount of time possible. These consumers see the tradeoff as fair and equitable, considering the value they are receiving in return. However, other consumers feel this is a breach of privacy. They are concerned about the long-term effects of companies knowing everything about his or her individual consumptive behavior. They worry about manipulation of data and or ads that could potentially push them to make unjustified purchases, due to their own vulnerabilities and susceptibilities to company ads, especially when that company may know more about their purchasing behavior than even the individual knows. But while the ethicality of this debate rages on, social media companies continue to update their Terms of Service Agreements in order to innovatively use behavioral data in new and profitable ways. Therefore, Van Dijck’s assessment of the current social media reality still rings true, “What is claimed to be ‘social’ is in fact the result of human input shaped by computed output, and vice versa.”
This reality is driven by user agency. User agency describes the functionality for which a person uses a social media channel for his or her own purpose. As we will see in the next section, whether a person uses social media to conduct research, sell products, or just lurk about, there is inevitably a co-evolution that occurs between the user and the social media algorithm. If you desire to be prevalent and provide enormous amounts of data to the social media company, then you should expect that it will know more about you and provide better contextual and relevant content. However, if you choose to refrain from using social media, then you accept that it will provide you less contextually relevant content. Therefore, currently, your social equity as an outcome is contingent upon the level of social input you choose to provide.
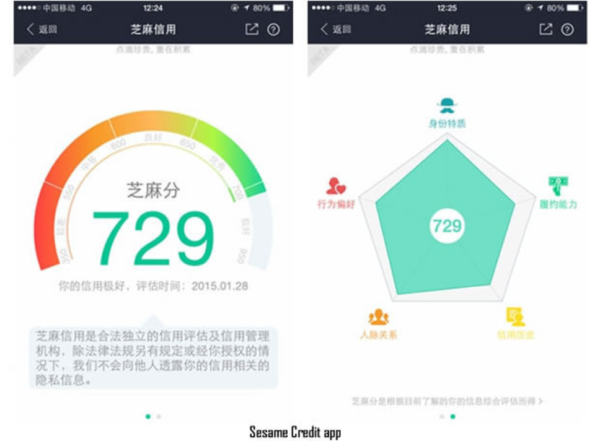 Although, this current theory of user agency is contingent upon the individual having a choice whether to use or not use social media upon their own discretion. Where this theory may fall apart in the future is when certain behaviors may become tied to your social equity. For example, China has recently invoked a “Social Credit Score.” As highlighted by CBS News[3], Chinese citizens are now receiving a social score related to many social aspects, like paying taxes or parking tickets. But it is also connected to their use of social media. In this report, a Chinese man who wrote critical comments on Twitter was barred from traveling or purchasing a home. In a democratically free society, “social” is an interplay between human input and computed output, but if governance structures begin to crack down on user agency as a primary input of the system, then the output of social media is sure to change as well. This example demonstrates the rapidly changing pace of social media on a seemingly daily basis, and how differences in worldview drastically impact the future of social media use in both personal and professional contexts. If everyone’s ability to buy a house will soon be tied to their social media presence online, as was mandatory in China in 2020, then it would seem that social media use would no longer be optional, but required, which destroys the current paradigm built on user agency.
While this direct use of a social credit score has not been implemented around the globe, there is little doubt that your social capital online does currently bear weight in many aspects of one’s life. Companies look at Facebook and Instagram pages when deciding to hire for particular job positions. Public figures, such as actors and politicians, have been black-balled from their industry based on social media profiles. Likewise, music stars have been born based on their social media channels. Inevitably, social capital is here to stay, the only question is, how much will it be regulated and used in the governance structures of the future?
Additional research demonstrates that in July of 2018, the Zephoria Digital Marketing group released “The Top 20 Valuable Facebook Statistics” report[4] (updated from the previous Top 15 report), which detailed Facebook’s immense footprint in this digital world. The report highlighted the following mind-boggling statistics:
- 2.2B monthly active users worldwide (29.2% of Earth’s Total Population).
- 1.7B mobile users worldwide, up 21% since December 2016.
- 1.4B daily users worldwide, up 11% since December 2016.
- 1.1B mobile daily users worldwide, up 23% since December 2016.
- 29.7% of users are age 25-34, the most common demographic.
- 76% of all females and 66% of all males use Facebook in some form.
- 300M photo uploads per day.
- 510,000 comments, 293,000 status updates, and 136,000 photos uploaded every 60 secs.
- 4.75B pieces of content shared daily.
- 50% of 18-24 year-olds go on Facebook as soon as they wake up.
- 16M local business have Facebook pages.
- Twitter only has 336M users and Instagram 1B users to Facebook’s 2.2B users
This social media giant rose from the mind of a couple of college students at Harvard University looking to create digital profiles for their college classmates in February of 2004. Facebook.com was launched in September of 2005 only a year-and-a-half later. By the next September, Yahoo and Google were reportedly interested in buying the company for $2 billion[5].
In 2007, Facebook launched the “Beacon” program. Beacon was planned to be an important component of the Facebook Ads platform at the time. It would track Facebook users’ activity online within participating websites. For example, Blockbuster was using the program and if you rented a video from the franchise, then it would report that rental back to Facebook, even if you were logged into Facebook or not. Additionally, it would alert your friends of your rental as well, unless you specifically checked the box for Facebook not to reveal that information. In other words, there was an automatic opt-in function for which you had to opt-out if you didn’t want to be a part of the program. Many consumer privacy groups, like MoveOn.org, complained and eventually brought a class-action lawsuit against Facebook[6]. About one year after the lawsuit was filed, Facebook shut down the controversial Beacon program, but a spokesman for Facebook, Barry Schnitt, provided this nugget of information: “We learned a great deal from the Beacon experience… For one, it underscored how critical is to provide extensive user control over how information is shared. We also learned how to effectively communicate changes that we make to the user experience[7].”
 As pointed out by Van Dijck[1], Facebook started a critical debate about consumer privacy. Topics such as what should be shared and how raged as Zuckerberg apologized to Facebook users about the perceived breach of privacy and loss of trust. No longer would they share private data with 3rd parties unless they had each individual’s permission. It was at this stage that Facebook realized they would have to change the cultural norm, but not the privacy norm, the sharing norm. Facebook set out to help their users realize they wanted to share this information, rather than Facebook sharing it for them, as with the Beacon program. The goal was still the same, Facebook just decided to come at it from the opposite angle. If the individual shares their behavioral data willingly, then the results would be the same. Hence, the “Like” button was born. In less than two years, Facebook had changed the sharing norm. The long- term problem with the Like button, is that it only collected data in the form of a 0 or a 1. Meaning, if you didn’t select the like button then the designated data code was a zero.
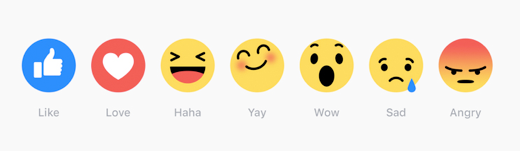
However, if you did select the Like button, then the data was designated a one. As any statistician will tell you, there is less “power” in binomial statistics. To get more variance, and therefore have more power in your statistical findings, you really should have more than two (binomial) options. This is why most surveys have semantic differential or likert scales with values of 1 to 5, 1 to 7, or 0 to 10. The more options that you provide, then the more variance you will get. The more variance provides better statistical analysis in predicting patterns with a statistical significance. Theoretically, this is why Facebook has moved from just the like button to a “range” of emotions. Each emotion, even though not demonstrated as a 1 to 7 scale, allows Facebook to have more variance in their behavioral data, and therefore, more power.
Today, with more bytes of data and information coming in, above that which they could even handle, the big data revolution is born. Companies are willing pay top dollar to for these datasets, allowing their data scientists to mine and code. The marketing possibilities are endless. And we as consumers have grown to appreciate their results. It’s faster, easier, and more convenient, and will continue to become that way with each passing day. With the same perspective towards critical history, Twitter and YouTube will be reviewed below. These companies are considered to be followers, not only because they came after Facebook in chronological order, but because they fall behind in the success of their user base and business model.
![]()
First, Twitter launched two years after Facebook in March of 2006. Designed as an SMS-based communications platform, Twitter limited each tweet to 140 characters, due to the limiting constraint of all SMS protocol standards. In the beginning, the early adopter was a 35+ year old professional, but as twitter quickly catered to news feeds and celebrity updates, the age demographic decreased quickly, and today, 10% of Twitter users account for over 90% of all tweets[1]. This indicates that the most influential twitter users were not just re-tweeters, but that influence was gained through a concerted effort towards a single topic. This is the essence of content leadership discussed in previous chapters. As expected, content leaders are successful at serializing messages to their primary verticals, or target markets, on Twitter.

But even though Twitter had explosive growth in the beginning, and today still has over 199M active users, it pales in comparison to Facebook’s 2.9B active users. Likewise, as seen in the chart above[8], Twitter’s ad revenue in 2018 was $1.47B compared to Facebook at $18.57B. Many critics of Twitter feel this is a fundamental defect in the vision cast by its founder Jack Dorsey, who stated,
“I think Twitter is a success for us when people stop talking about it, when we stop doing these panels and people just use it as a utility, use it like electricity. It fades into the background, something that’s just a part of communication. We put it on the same level as any communication device. So, e-mail, SMS, phone. That’s where we want to be.”
Van Dijck argues that Twitter has confined itself to a permanent stage of interpretive flexibility. In other words, it is in a stage of flux where various, and sometimes contradictory, interpretations are wagered before stabilization is reached. If the above quote becomes true, then like water pipes and electrical wires fade from perspective, then the brand Twitter would also fade from perspective, fading into obscurity becoming as neutral as SMS or text messages[1]. This vision of neutrality is likely to explain why so many users and businesses struggle to find the relevancy of Twitter in their daily activities, and possibly why advertising has grown relatively little, less than 5% annually (compared to 33% for Facebook), over the last few years (calculated from chart above).
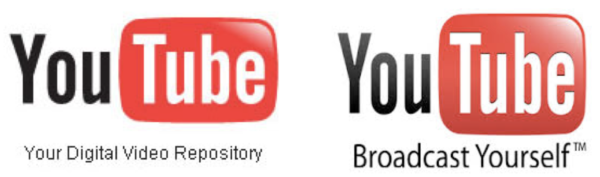
YouTube was created in a Silicon Valley garage in 2005 by three PayPal employees, Steve Chen, Jawed Karim, and Chad Hurley. Created to be a video digital repository, YouTube’s original logo stated as much (above on the left). However, in the early days of the platform, a divergent path quickly came into view. Was the repository for build for user-generated content or for professionally generated content?
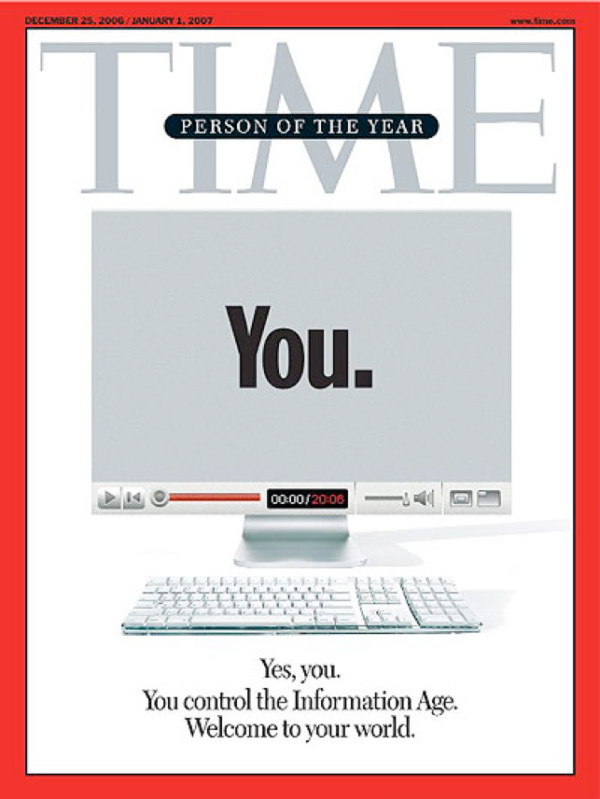 User-generated content (UGC) was being created by individuals who would record their own home videos and upload them to the repository. However, there were a number of users who would record professionally-generated content (PGC), like a television show, and then upload the recording to YouTube. Both types of users were generating large quantities of content to the repository, helping the social media channel to grow exponentially. In order to welcome both contingencies, in 2006, YouTube created a new logo (above on the right). It was “YouTube: Broadcast Yourself.” Ingeniously, as Van Dijck points out, this motto had a dual meaning[1]. You could either “Broadcast Yourself” online, meaning you could record yourself and upload it to YouTube, known as homecasting. Or, the alternative meaning represented you could “Broadcast, Yourself” online. The comma makes all the difference. This second meaning meant you, yourself, could literally post any video content you possessed online, known as broadcasting. For their innovation, You, as in You-tubers, were voted as Time Magazine’s 2006 Person of the Year, which also assisted in the purchase of YouTube by Google for $1.26B.
With this type of media coverage, active user agency soared and social media referrals to millions of YouTube channels spiked, but so did the attention of the producers of the professionally generated content. From 2008-2012, YouTube wrestled with broadcast companies over the reproduction of their content. Depending on the broadcast network, court room battles raged on as broadcast companies, themselves, wrestled with whether YouTube was a friend or foe. Some companies wanted to shut the reproducing of content down completely with intellectual property and copyright law, while others debated on the innovative use of their platform to potentially highlight new created content just for their user audience. Was this a way for broadcast companies to break into a new medium with a new audience?
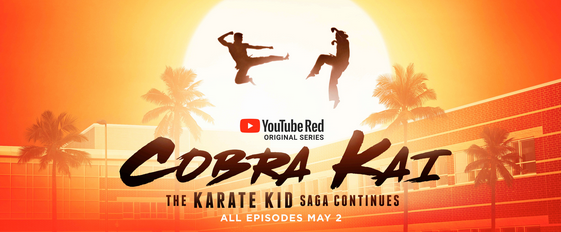 As time would demonstrate, broadcast companies would come to embrace YouTube as viable partner in releasing new content, like the extremely popular YouTube Original Show, Cobra Kai, which takes place thirty-four years after the original Karate Kid movie where Daniel LaRusso defeats Johnny Lawrence in the 1984 All Valley Karate Tournament. Played by the original actors Ralph Macchio and William Zabka, fans of the original Karate Kid franchise have swooned all over the series demanding more seasons, for which Netflix has picked up and produced to the fans excitement.
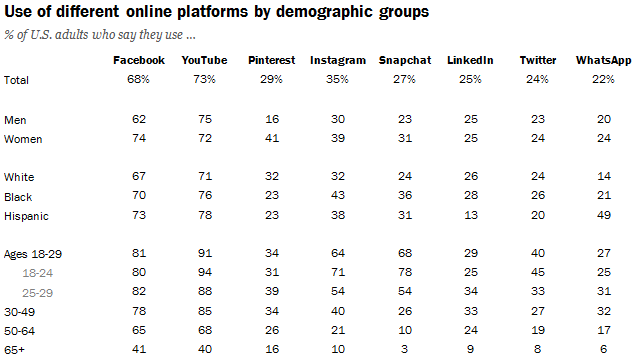
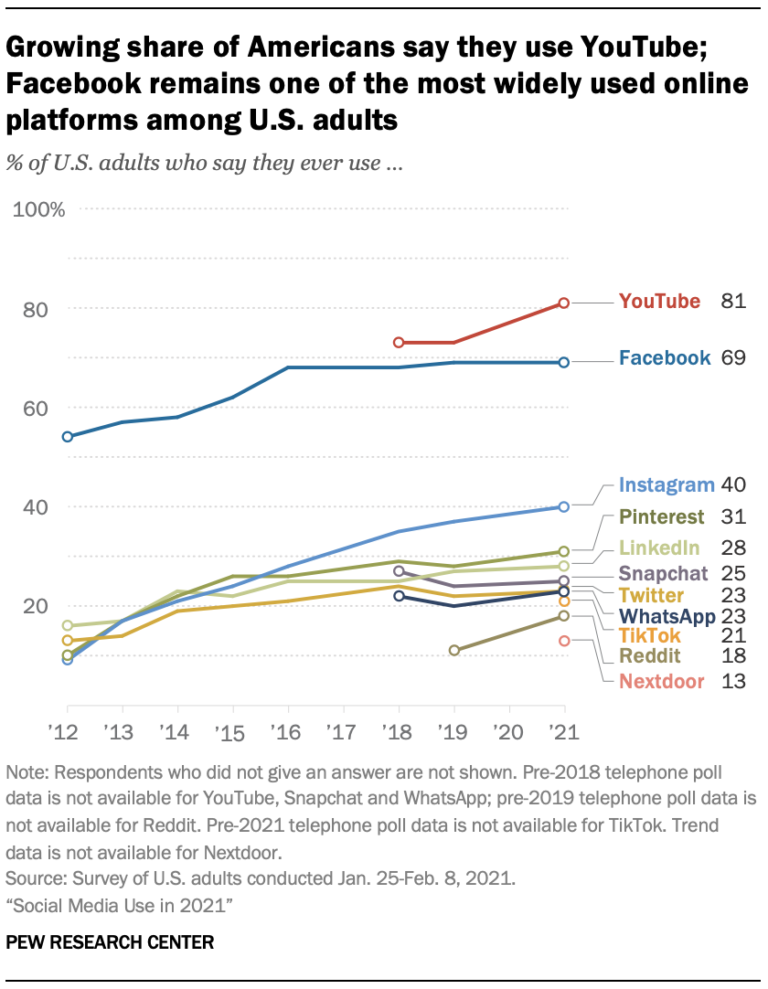 Today, at more than 2B active users, YouTube has 10 times the number of users as Twitter, falling only behind Facebook (2.9B) in that category. It is the second largest search engine on the Internet, only surpassed by its owner, Google, and it trails only Facebook in forecasted ad revenue in 2018 at $8.1B, which is 57% less than Facebook at $18.57B and 5.5 times that of Twitter at $1.47B. These statistics suggest that there is a significantly positive correlation between the number of users and ad revenue for all three of these social media channels; however, YouTube has yet to capitalize on ad revenue as well as Facebook. With almost as many users, YouTube is less than half the ad revenue of Facebook, reinforcing the “giant” status of Facebook. Even though younger consumers may be gravitating to other social media channels, like Instagram and SnapChat, these platforms still cannot even be discussed in the same dimension as Facebook or YouTube. For example, view the Pew Research Center Data[9] for 2021 (as shown to the right). Additionally, as demonstrated in the graphic below, even though Facebook and YouTube dominate the digital landscape for all adults, 80% of 18 to 24-year-old adults still report using Facebook while only 71% and 78% report using Instagram and Snapchat respectively. Maybe shockingly to most young people ages 19-29, according to the Pew Research Data of 2021, Facebook still out paces every other social media channel in this age group, except for YouTube.
References:
[1] Van Dijck, José. The Culture of Connectivity: A Critical History of Social Media. Oxford University Press, 2013.
[2] Digital Trends: Is your smartphone listening to everything you say? We asked the experts. https://www.digitaltrends.com/mobile/is-your-smartphone-listening-to-your-conversations/. Accessed 10/18/22.
[3] CBS NEWS: China’s behavior monitoring system bars some from travel, purchasing property. https://www.cbsnews.com/news/china-social-credit-system-surveillance-cameras/. Accessed 10/18/22.
[4] Zephoria.com: The Top 20 Valuable Facebook Statistics. https://zephoria.com/top-15-valuable-facebook-statistics/. Accessed 10/18/22.
[5] theGuardian.com: A Brief History of Facebook. https://www.theguardian.com/technology/2007/jul/25/media.newmedia. Accessed 10/18/22.
[6] PCWorld: Facebook’s Beacon More Intrusive Than Originally Thought. https://www.computerworld.com/article/2814132/ca–facebook-s-beacon-more-intrusive-than-previously-thought.html. Accessed 10/18/22.
[7] The Telegraph: Facebook Shuts Down Beacon. https://www.telegraph.co.uk/technology/facebook/6214370/Facebook-shuts-down-Beacon.html. Accessed 10/18/22.
[8] Statistica.com: Advertising Revenues of Selected Social Networks in the United States from 2015 to 2018. https://www.statista.com/statistics/426520/us-social-networks-ad-revenues/. Accessed 10/18/22.
[9] Pew Research Center: Social Media Use in 2021. http://www.pewinternet.org/2018/03/01/social-media-use-in-2018/. Accessed 10/18/22.