InGen Analytics
Finally, for any company or individual running an inbound marketing campaign, a consistent audit of the important metrics described in the last few sections is vital to managerial decision making. To make this audit process easier, your analytical measures across platforms will be broken up into these three categories for easy monitoring. They include:
- Brand Awareness: the total number of users, new users, sessions, or pageview on your website
- Brand Acquisition: whether consumers are coming to your site due to email, social channels, organic search, or backlink referrals from other websites,
- Brand Retention: tracking through goals how many users are completing your call-to-actions, subscribing to your email campaign, and opening/clicking-through your actual emails.
In all of these categories, managerial decision making should be based off of the analytics. Therefore, we have developed a proprietary progress report system that will be used during the entire campaign. This reporting mechanism should be a guide to you about how the campaign is performing and how it may need to be adjusted appropriately.
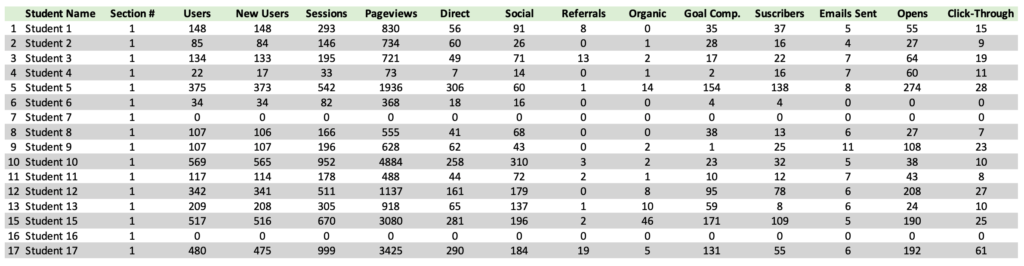
First, you will provide the raw data from all of your analytical platforms on a weekly basis through an online reporting mechanism called the InGen Report. As demonstrated below, data will be collected across mulitiple items for each of the categories of brand awareness, brand acquisition, and brand retention. Note: Metrics will be reported cumulatively each week, meaning that Week 3’s report will include all of the data for Week 1, 2, and 3 of your campaign. This cumulative reporting allows you to see how your website is growing each week. Like an annuity investment, if you are performing the campaign correctly, then you should see compounded growth each week, as the previous week’s blogs will still be helping increase traffic in future weeks (that is, if it is good content). The raw data will look like this:
Additionally, in higher education courses, using the raw data the InGen Report will establish a set of grades associated with each of the single items. These grades are calculated from the mean and standard deviation for each of the single items across each student in your class. This component of course assessment is based on a competition. Just like the real world, you are competing against every other blogger in your domain, every other company in your product or service category, every other employee at your work for the promotion, and realistically, you are even competing against yourself to grow your social impact week over week, month over month, and year over year. We have found that many students have trouble with the competition side of this practicum, but we implore you to get used to this aspect. As soon as you graduate, competition becomes the name of the game in a free-market society. And just like the real world, part of your practicum grade in this course is based on how well you do on each of these metrics verses the other students in your class.

Along with each of the per item grades, you will also see a categorical grade, one each for Brand Awareness, Brand Acquisition, and Brand Retention. These categorical grades are averages for each of the items in each category. However, the purpose of these categorical grades is to realize how well (or poorly) you are doing in any one category. The category that has the lowest grade is one that you should probably focus on more diligently in order to improve your overall campaign performance. Note: Your performance is HIGHLY CORRELATED with how hard your work on your campaign. If you put in the time, then you will receive the reward, but be sure to start at a sprint because like the annuity metaphor, each week’s metrics are compounding. You want to get the full compounding effect over the entire campaign, so start strong and keep running the race.